Here is Part 6 of our STP series. The past five articles on STP have introduced: (1) the concept of attended and unattended automation; (2) why STP is important; (3)how to achieve high STP in document automation; (4) examples of what it looks like; and (5) how to accurately assess STP.
Technical Side of STP: Confidence Scores and Thresholds
Delving into the underlying intelligent capture technology behind achieving STP requires examining confidence scores. In client engagements and in conversations with analysts and consultants, the topic of confidence scores almost always comes up.
Far too often, there is a lack of understanding of what confidence scores actual are and how they are used. A common question is something like, “do you display confidence scores to users?” This question reveals a fundamental lack of understanding so let’s dig deeper into some common misunderstandings and the realities.
Confidence Scores are not Probabilistic
Why is displaying a confidence score not useful? Because a score by itself has no specific ability to communicate whether the associated data output is accurate or not. A confidence score of 80 does not mean that it “has an 80% probability of being correct.” So if this is the case, “what good are they?” you might ask.
First, let’s use an analogy. Suppose there was a test for which a student got 30 questions correct and they come to you to ask what the resulting grade is. Could you give them a grade? No, you’d likely ask how many total questions there were on the exam. Confidence scores are similar in that you need more context in order to make them useful. Instead of knowing the total number of questions on the exam, you need to understand the full range of confidence scores for any particular answer value.
A Practical Example: Invoice Data Extraction
For instance, let’s suppose we have 1000 invoices that we use to configure and measure a system. For this project, we wish to use confidence scores to determine when the “Invoice Total” field is likely to be accurate vs. likely inaccurate.
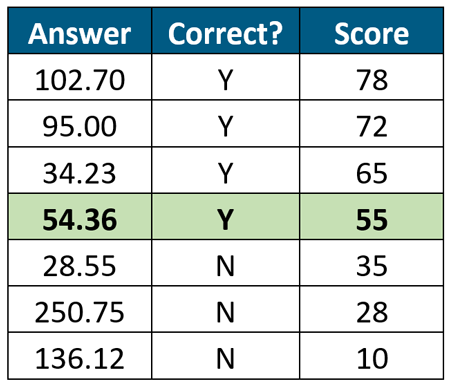
Rather than evaluate a single “Invoice Total” confidence score from the thousand, we evaluate the scores for all 1000 invoices. Doing this, we can evaluate what “Invoice Total” answers are correct and which ones are incorrect, noting the confidence score ranges for the correct and incorrect answers. We can then order the answers by confidence score from largest to smallest. It might look something like this:
In this sorted view of “Invoice Total” answers, we can see that answers with scores below 55 are more likely incorrect while scores with 55 or above are likely correct. Of course the total sorted list would consist of 1000 answers, but you get the point. The only way to use confidence scores is to take a sizable set of output and perform this exercise for each data field. Using this example, a score of 55 doesn’t mean 55% probability of being accurate, it simply means that, based upon analysis, it is likely to be correct.
What About Probability?
Up until now, we have only shown how to use confidence scores to separate likely accurate data from likely inaccurate data. So how do we calculate probability? The answer is that we must analyze a large sample set (that 1000 invoices is a good number) of representative data. “Representative” means that your sample data resembles your actual data. And then, you have to perform a lot more analysis to get to an understanding of individual score accuracy.
For instance, once again using the analogy of the exam, you will calculate the accuracy rate of all answers above and below the threshold. You might find that 450 answers out of 500, which are above the threshold are accurate. This equates to an accuracy rate of 90%. And then, you might group each answer by the score and find that, our of 50 answers with a score of 85, 48 are correct, yielding an accuracy rate of 96%. You might calculate all of these numbers. Ultimately, you can get to a level of understanding to calculate the accuracy rate for each confidence score. This is how confidence scores should be evaluated and used.
The reality is that this is a lot of work that few organizations perform due to the complexity and time requirements.
The Ugly Truth
Confidence scores, by themselves don’t mean anything, yet many organizations act under that presumption. This behavior results in either increased risk or increase cost. That is, the risk of letting bad data go through (e.g., all incorrect answers with a score of 80 go through) or spending a lot of effort to review each answer (e.g., the system never produces high confidence scores).
Most of the time, organizations don’t trust the system because they are not able to adequately measure it – so they verify 100% of the system output. We have also observed systems that cannot produce reliable confidence scores at all – so there is no ability to use them; this also forces 100% manual review to ensure accuracy. This is not the definition of straight through processing.
###
If you found this article interesting, you may find this executive briefing on What Is Accuracy? useful.


